Determination of the Working Area of an Electrode
Goals
The goals of this experiment are to:
- Understand concentration distance profiles
- Become with familiar with the Cottrell and Anson plots
- Learn how to use the Cottrell and Anson equations to calculate the active surface
area of the working electrode.
Experimental Apparatus
- Gamry Instruments Interface 1000T
- Gamry Instruments Framework™ software package installed on a host computer
- Screen-printed electrode cell stand (Gamry part number 990-00420)
- Carbon working screen-printed electrode (Gamry part number 935-00120)
Reagents and Chemicals
- 0.1 M potassium chloride, pre-purged to remove dissolved O2
- 2 mM potassium ferricyanide in 0.1 M potassium chloride, pre-purged to remove dissolved O2
CAUTION:
Cyanide-containing compounds can hydrolyze to form hydrogen cyanide gas,
which is highly poisonous. Never pour potassium ferricyanide down the drain!
Background
Chronoamperometry is the measurement of current at a fixed potential over time.
When the potential is initially applied, there is a large current response caused by
two different currents.
- The first is the electrolysis of analyte at the surface of the electrode, called the
faradaic current. The faradaic current, ifar, decreases as the analyte is consumed at the surface and replenished via diffusion. - There is also a capacitive current, related to the charge accumulation (a capacitance) that occurs at the electrode surface when the potential is changed.
This capacitive current, icap, dissipates in an exponential fashion, which is much quicker than the diffusion-controlled decrease in the faradaic current, thus at longer times the ratio ifar/icap is large.
Chronoamperometry is commonly used in electrochemistry because of its ability
to provide much useful information in a short amount of time (seconds). The results, as a current, from the experiment can then be integrated with respect to time to provide plots of the charge over time, or chronocoulometry graphs. Using these data, you can calculate the working surface area of the electrode, concentration of the analyte, or diffusion coefficient of the analyte. Chronoamperometry can also provide kinetic information about heterogeneous electron transfers, or adsorption processes.
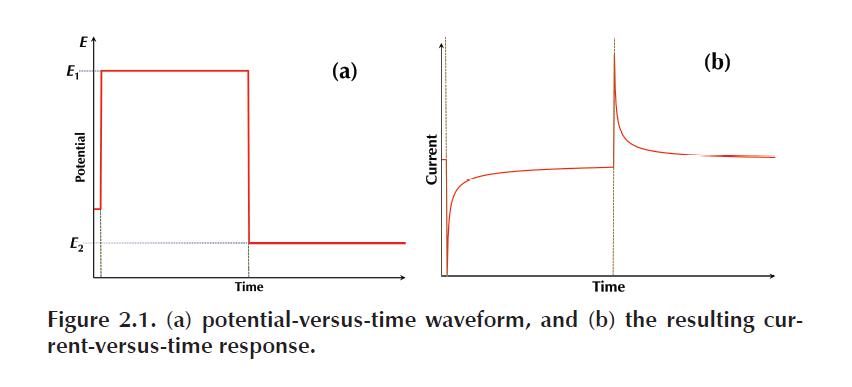
During a chronoamperometry experiment, the procedure begins at a potential
where no reaction occurs, the open-circuit potential, Eoc. From there the potential is changed in one step to a potential where either the oxidation or reduction of the analyte occurs. The potential can then be switched, in a double-step-chronoamperometry experiment, to a voltage where reverse electrolysis occurs. The waveform of potential versus time is sketched in Figure 2.1(a), with an example of the current- versus-time response from the experiment in 2.1(b).